Ischemic stroke affects blood flow in cerebral arteries. Techniques like TCD allow the calculation of various autoregulation indices and continuous assessment of critical closing pressure.
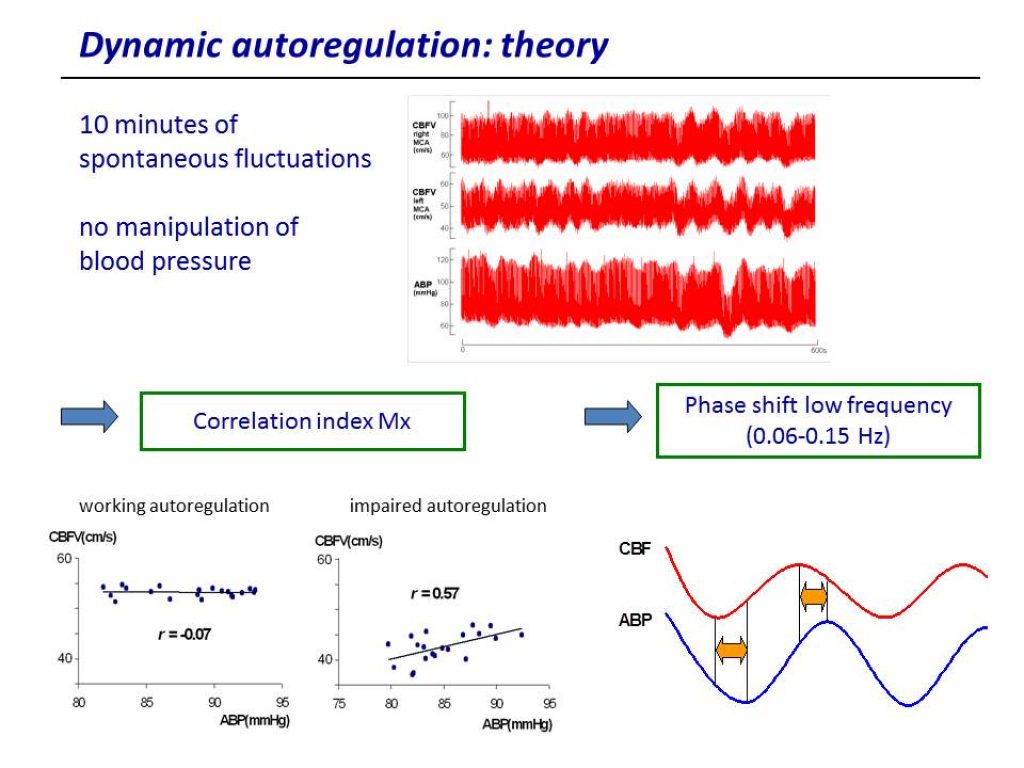
ICM+ can be used to explore data collected intermittently using TCD and NIRS in this population. For assessment of cerebral autoregulation, correlation methods could be used for the TCD-based index Mx and the NIRS-based index Cox. The phase shift analysis between FV and ABP slow waves is also supported as a dedicated function.
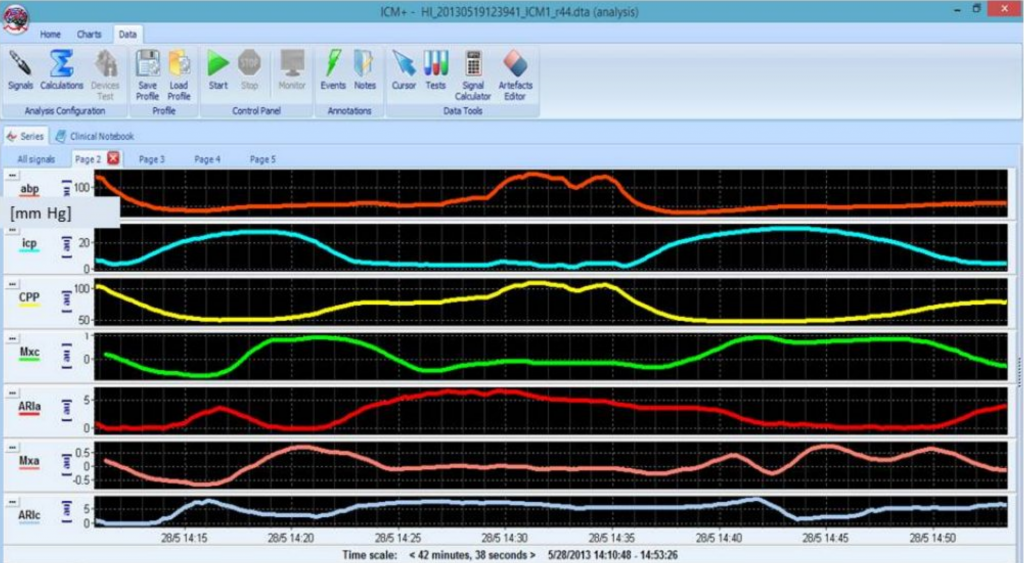
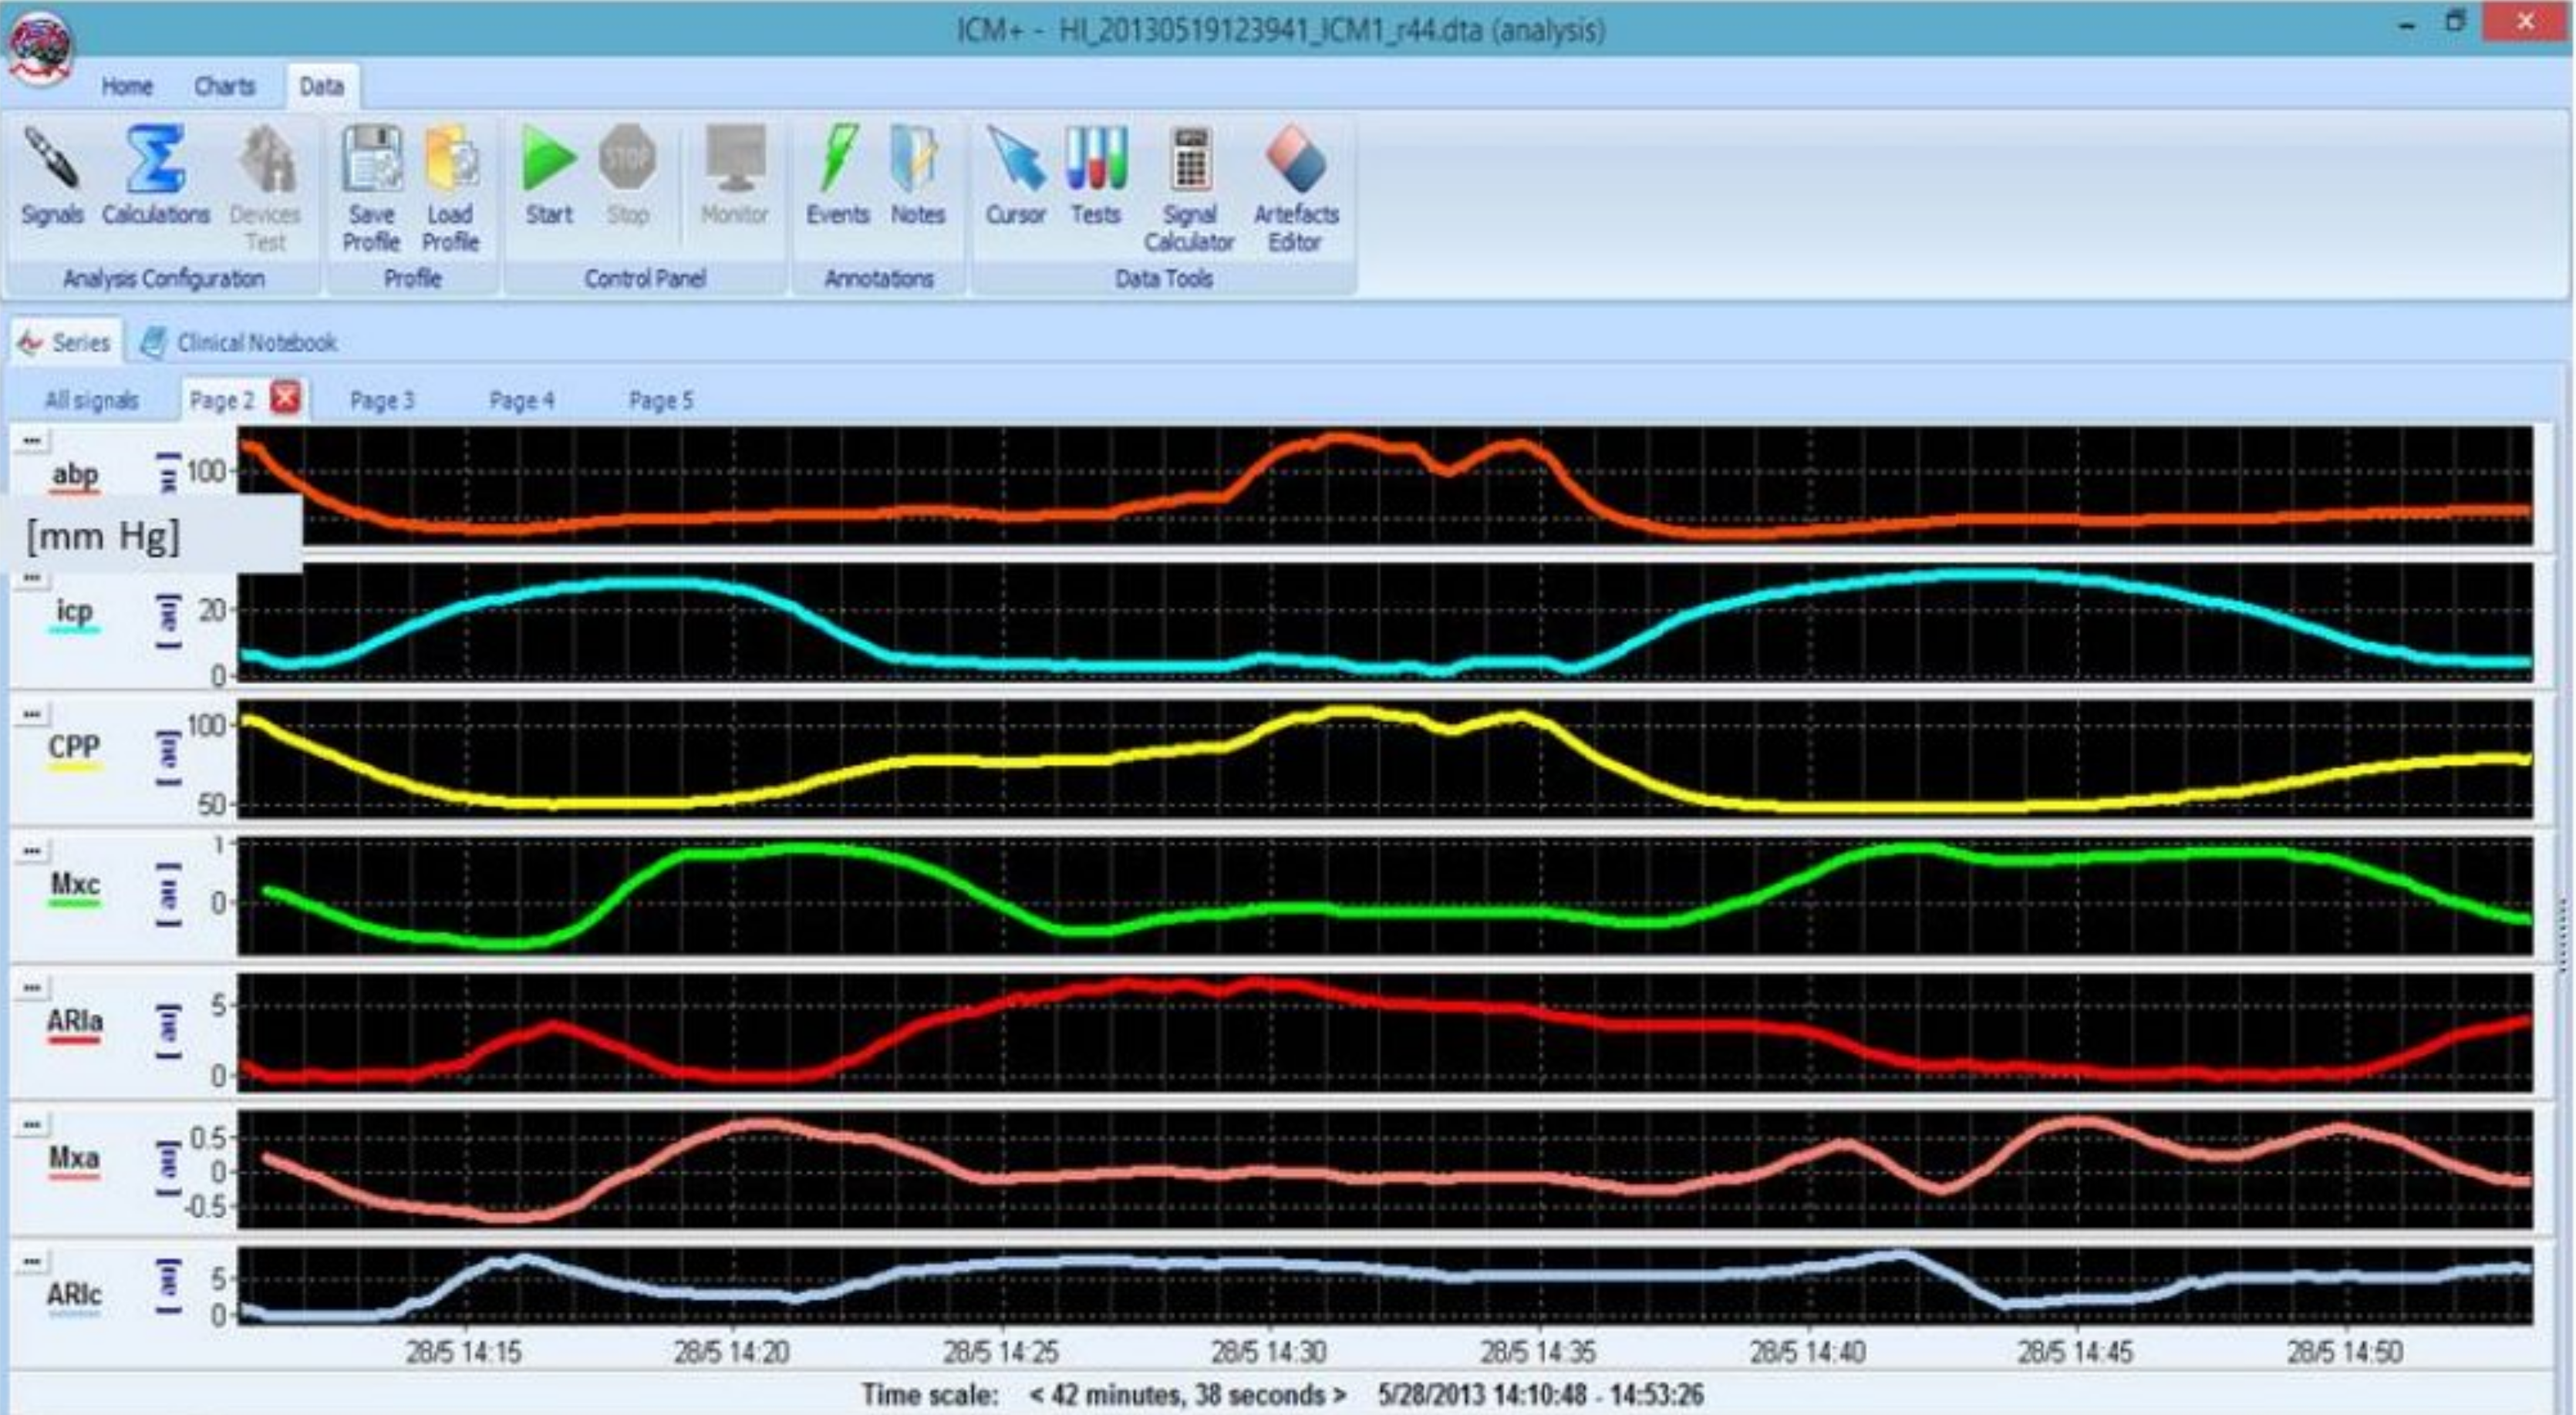
Autoregulation Index (ARI) can be also evaluated, and changes of the index in time may inform on dynamical processes influencing autoregulation – there is a dedicated function for this analysis. View image
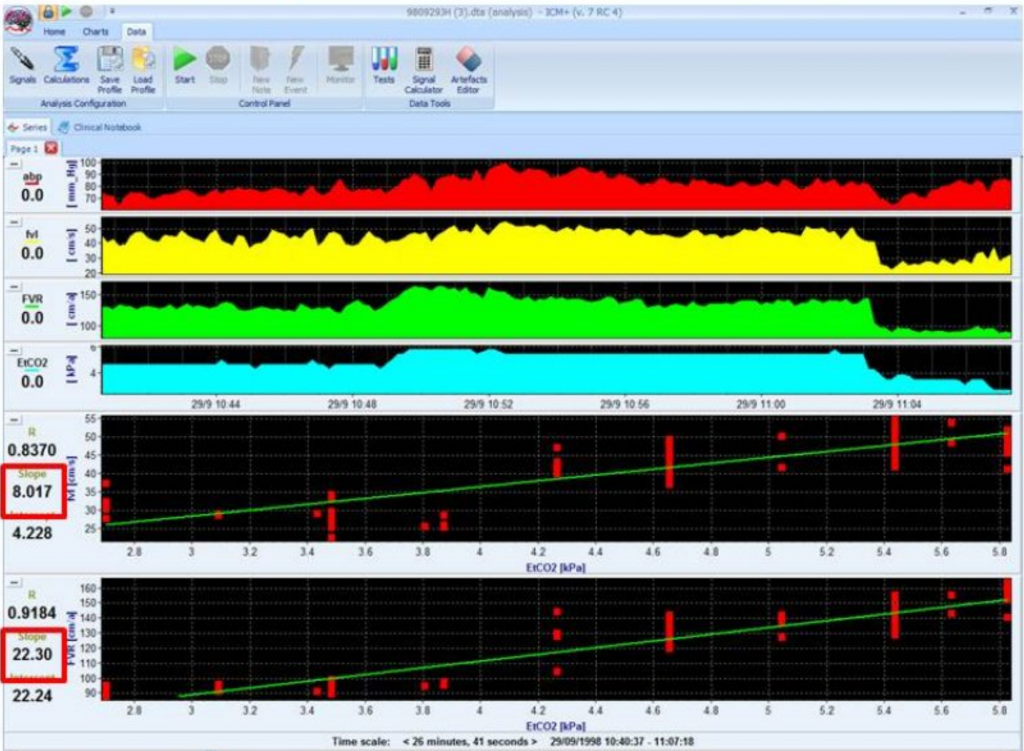
Left side impairment of reactivity (85% of stenosis). The right side is clear. FVL, cerebral blood flow on the left side; FVR, cerebral blood flow on the right side; ETCO2, end-tidal CO2 concentration. View image
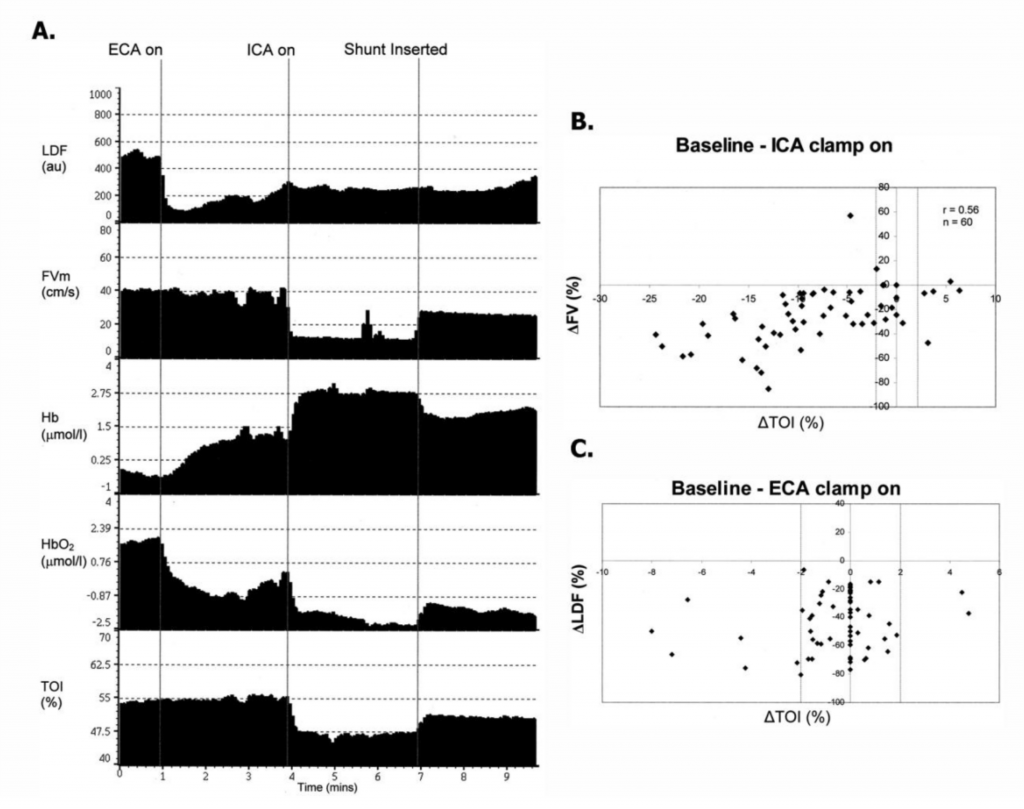
Intraoperative monitoring with TCD and NIRS during carotid artery stenosis surgery helps to reduce risk of ischemic insults . Here is an example of time trends of parameters monitored during ECA and ICA clamping. LDF measured on the surface of the skin, and FV in the MCA and NIRS on the scalp over the frontal bone. When the ECA was clamped, LDF signal decreased and NIRS Hb and HbO2 (modified Beer-Lambert law) showed corresponding changes, however no changes were visible in TOI (SRS). When the ICA was clamped, LDF was unaffected while TOI decreased along FV B. Scatterplot of percent change in FV vs. percent change in TOI from baseline to after application of ICA clamp. The vertical dotted lines show the range outside of which ΔTOI was considered significant. C. Scatterplot of percent change in LDF vs. percent change in TOI from baseline to after application of ECA clamp. The vertical dotted lines show the range outside of which ΔTOI was considered significant. ECA – external carotid artery; FV – flow velocity; Hb and HbO2 – deoxygenated and oxygenated haemoglobin respectively; ICA – internal carotid artery; LDF – laser Doppler flowmetry; NIRS – near-infrared spectroscopy; TOI – tissue oxygenation index; SRS – spatially resolved spectroscopy. View image