Multimodal monitoring in the laboratory requires computer support. Various protocols in different centres have been used. Apart from classical signals like in TBI, monitors like laser Doppler flowmetry, rheoencephalography, NIRS, diffused correlation spectroscopy, etc., are verified. Various novel secondary indices can be designed and tested in an experimental environment.
Experimental Laboratory
The software ICM (a previous version of ICM+) was used for the collection and processing of data from animal models during the years of 1995 and 1996 in Cambridge in accordance with guidelines of the United Kingdom Animals (Scientific Procedures) Act of 1986. During this time, data from several cohorts of New Zealand rabbits was collected and has been under scrutiny until recently.
- One of these cohorts was a population of 28 rabbits, anaesthetised and ventilated, where severe intracranial hypertension was induced until the Cushing response occurred. These rabbits were being monitored by ICM during the duration of the experiment. Here, high-resolution data of ICP, ABP, Fv in the middle cerebral artery (MCA), Laser Doppler Flowetry (LDF)and PaCO2 signals were collected.
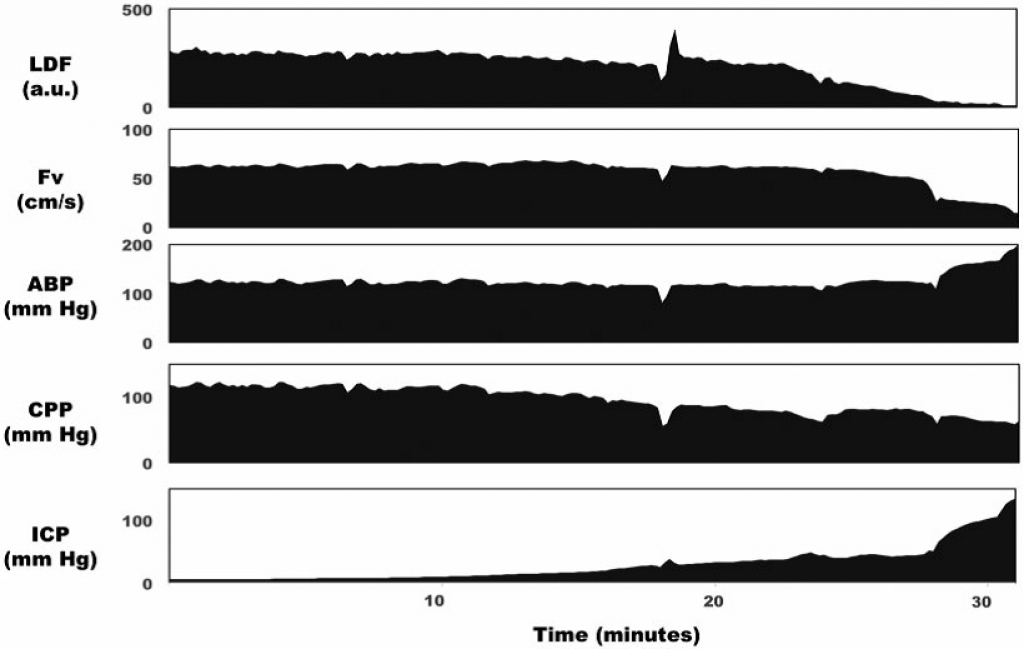
ICP was increased over the period of 30 min from baseline levels (10mm Hg) to high levels (>100mm Hg). Cortical LDF (top panel) decreased with this increasing ICP, whereas Fv in the basilar artery remained stable until ICP was above 50mm Hg. Mean arterial blood pressure increased when ICP increased above 30mm Hg as part of the Cushing reflex. LDF: laser Doppler flowmetry; Fv: flow velocity in the basilar artery; ABP: arterial blood pressure; CPP: cerebral perfusion pressure; ICP: intracranial pressure. View image
Several retrospective studies were performed using the data generated by this cohort.
One example of this was published by Donnelly et al., where it was found that Fv was unchanged for ICP pressures up to 41 mmHg, ABP increased, and LDF and wall tension decreased. For higher pressures, the ABP kept increasing and the Fv started decreasing alongside LDF, but wall tension remained the same. This helped to demonstrate two intracranial pressure-dependent cerebroprotective mechanisms: with moderate increases in intracranial pressure, wall tension decreased and arterial blood pressure increased, while with severe increases in intracranial pressure, an arterial blood pressure increase predominated.

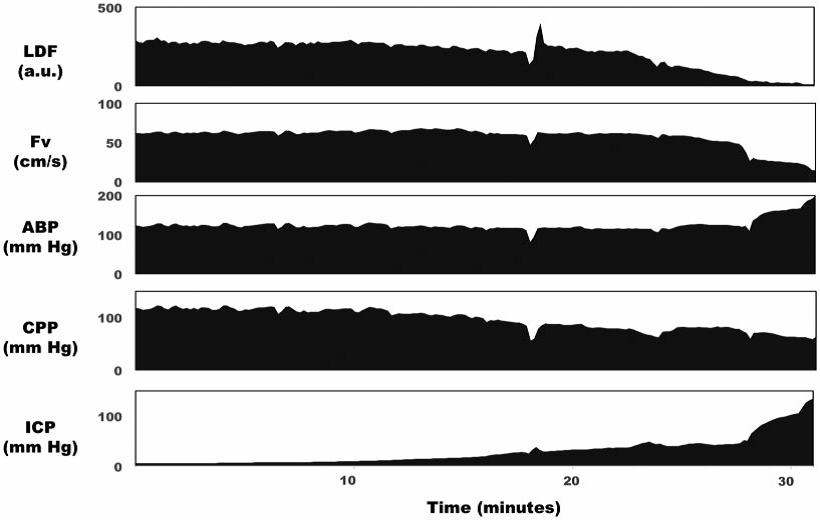
In the same rabbit as in the previous image, progressive increases in ICP caused an increase in CrCP, and ABP diastolic, as well as a corresponding decrease in the difference between them – the diastolic closing margin (second panel). At very high ICP, CrCP approached ABPd, which was associated with a drop of diastolic flow velocity to zero (top panel). AMP of ICP increased along with mean ICP until very high ICP, at which point AMP began to decrease (third panel). CrCP: critical closing pressure; ABPd: diastolic arterial blood pressure; Fvs: systolic flow velocity in the basilar artery; Fvd: diastolic flow velocity in the basilar artery; AMP: pulse amplitude of ICP; ICP: intracranial pressure. View image
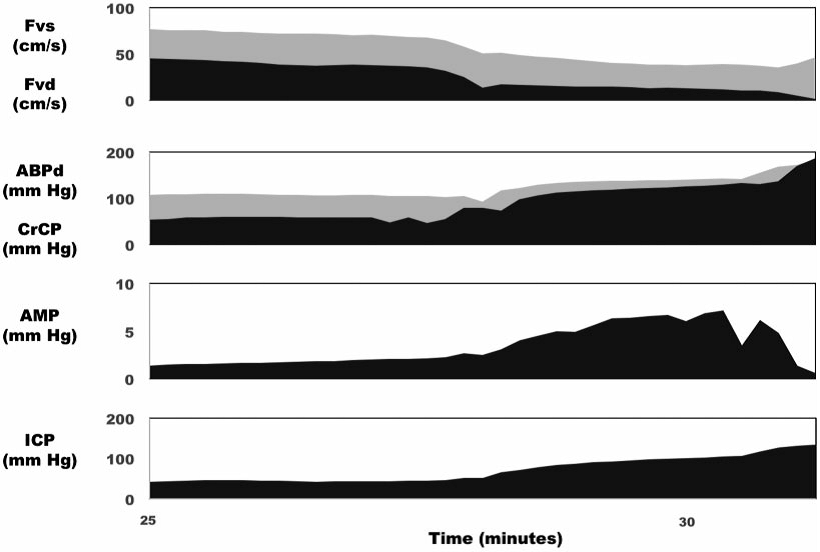
In another study on this data from the same cohort of rabbits published by Robba et al, where new techniques to access ICP non-invasively were studied: Gosling’s pulsatility index PI (gPI), Aaslid’s method (AaICP), and a method based on diastolic blood flow velocity (FVdICP). All methods proved to produce a nICP value significantly correlated with the real ICP. It was also shown that, even though non-invasive methods do not generate accurate values for the real ICP, they are very good in detecting the changes of ICP in time. In this work, ICM+ was used to process the raw data and calculate the nICP value using the three algorithms.

In all of the examples, it is shown that progressive intracranial hypertension owes to the infusion of Hartmann’s solution into the lumbar subarachnoid space and corresponding non-invasive intracranial pressure (nICP) calculated with FVdICP and the Aaslid formula. a An example of good correlation between ICP and nICP in a single rabbit. From top to the bottom, invasive ICP and then nICP measured with FVdICP, and the Aaslid formula. b An example of bad correlations of ICP in a single rabbit with the two methods. View image
- In another cohort consisting of 29 male rabbits, anaesthetized and ventilated where Hartman’s solution was infused into the spinal subarachnoid space, generating episodes of intracranial hypertension. In addition to this, arterial hypotension was induced by using trimetaphan to a part of the cohort and to the other, periods of hypo and hypercapnia were induced by changing the arterial PaCO2. These rabbits also were being monitored by ICM during all the duration of the experiment and high resolution data of ICP, ABP, Fv in the MCA, Laser Doppler Flowetry LDF and PaCO2 was collected.
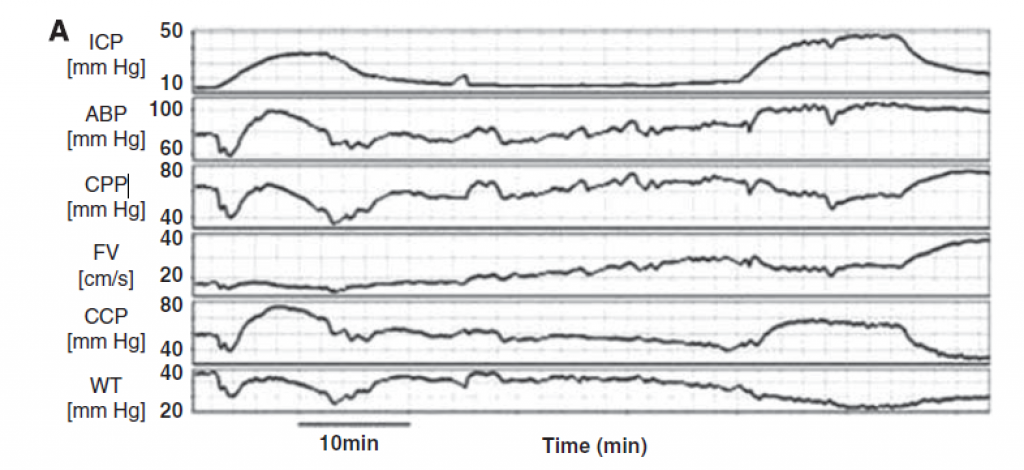
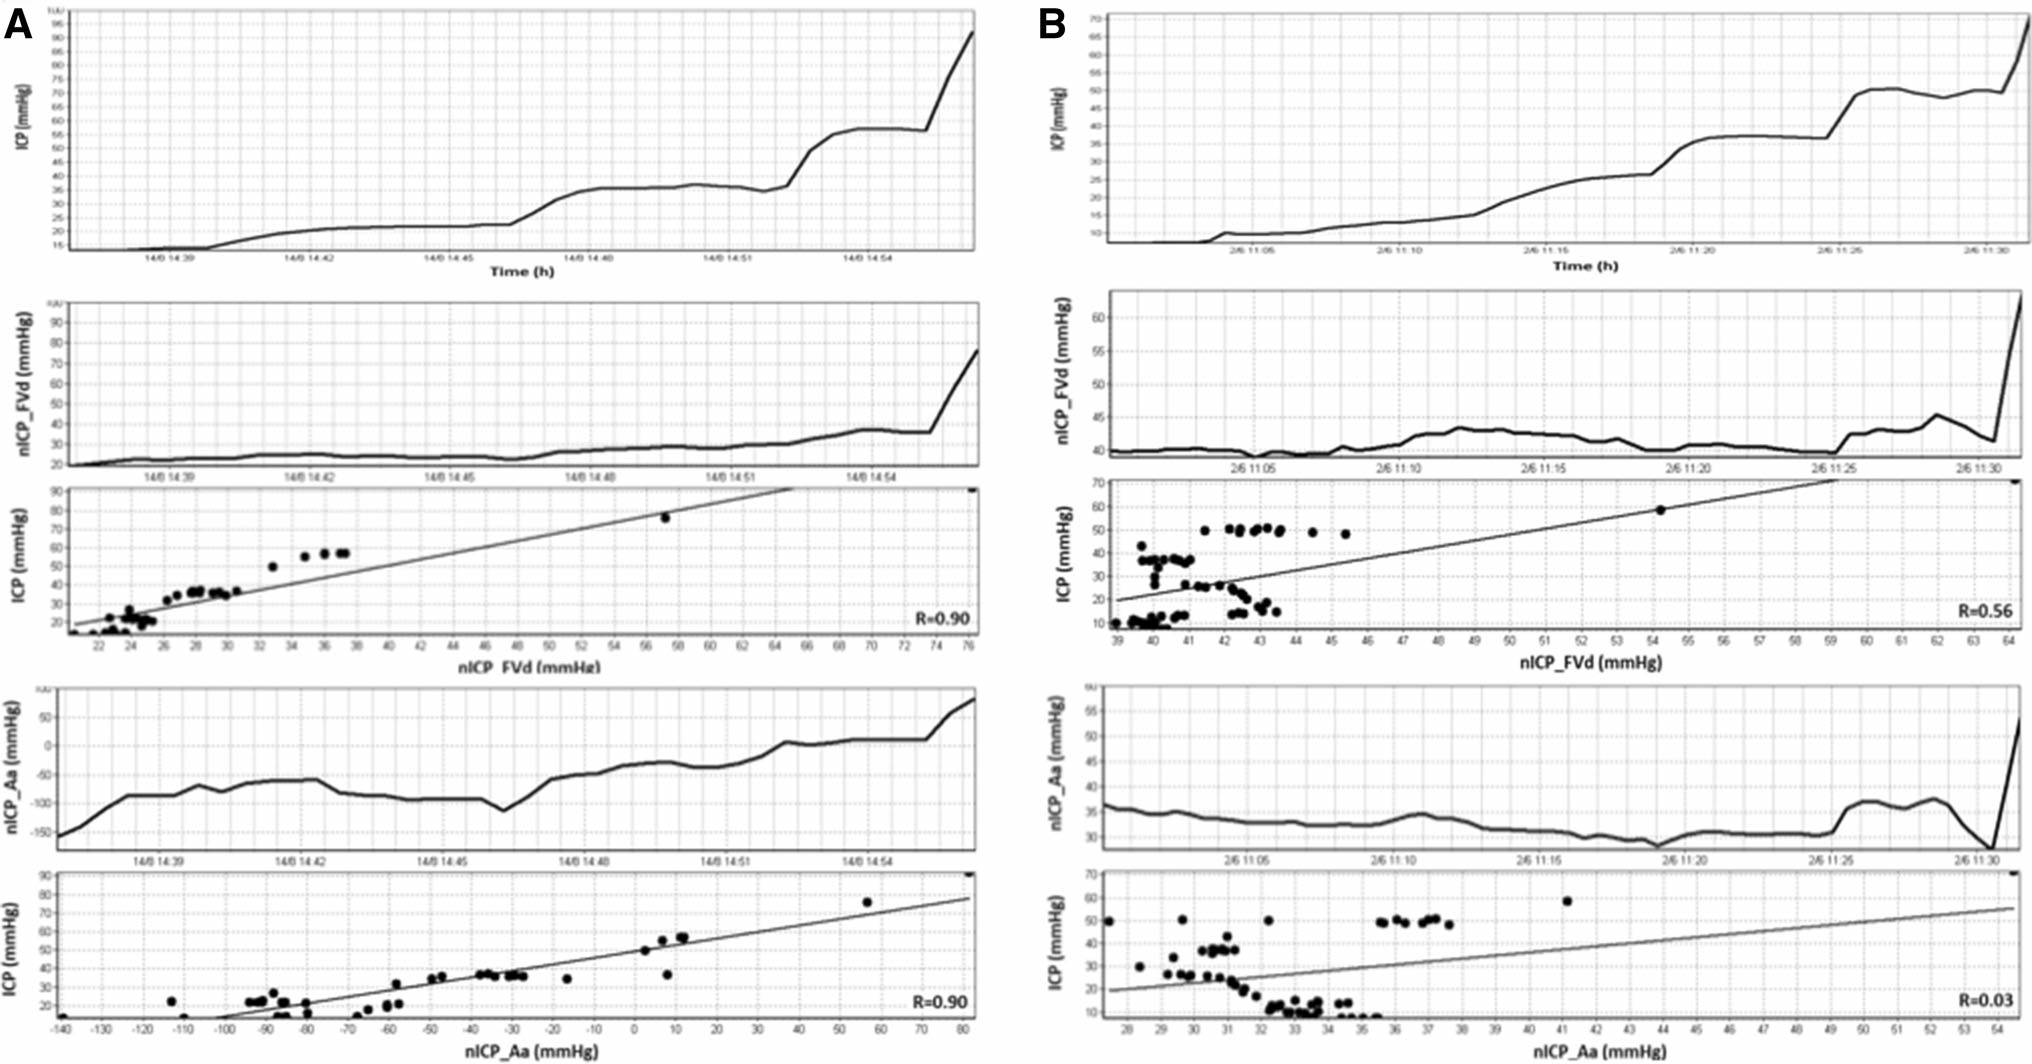
(A) Intracranial hypertension owing to the infusion of normal saline into the lumbar subarachnoid space at a rate of 0.15 mL/minute and the corresponding waveforms of arterial blood pressure (ABP), cerebral perfusion pressure (CPP), flow velocity (FV), critical closing pressure (CCP), and wall tension (WT). View image

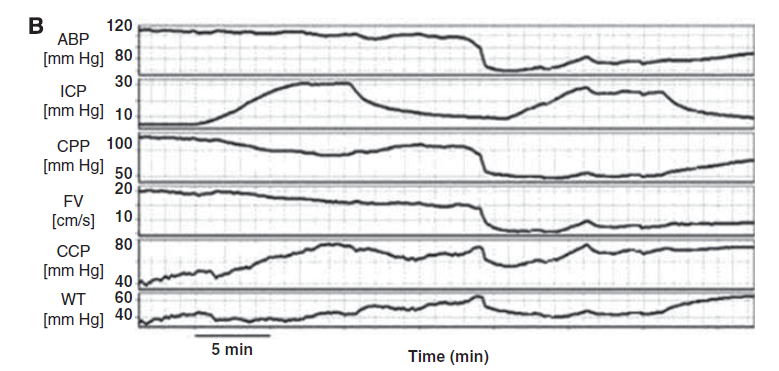
(B) Trimetaphan-induced arterial hypotension and the corresponding waveforms of intracranial pressure (ICP), CPP, FV, CCP, and wall tension (WT). In both figures, CCP has been calculated with the first harmonic model of critical closing pressure (CCP1). Gaps left after artefacts removal have been interpolated graphically. View image
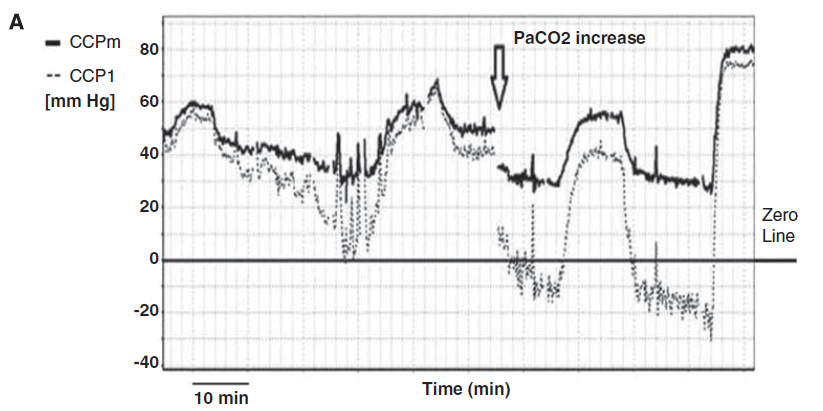
Similar to the data in the previous cohort of rabbits, several studies were published using the data collected. One example is the work presented by Varsos et al where a new method for calculating for Critical Closing Pressure (CCP) was compared with the most accepted method CCP1. This new method calculated CCP using CPP, ABP, HR and cerebrovascular time constant. On the other side, the most accepted method used ABP and Fv for CCP calculation. The values generated by the new method proved to be highly correlated with the values generated by CCP1. Due to the nature of the variables used to calculate CCP, the new method is capable of generating physiological values for CPP for moments where CCP1 failed in doing so.
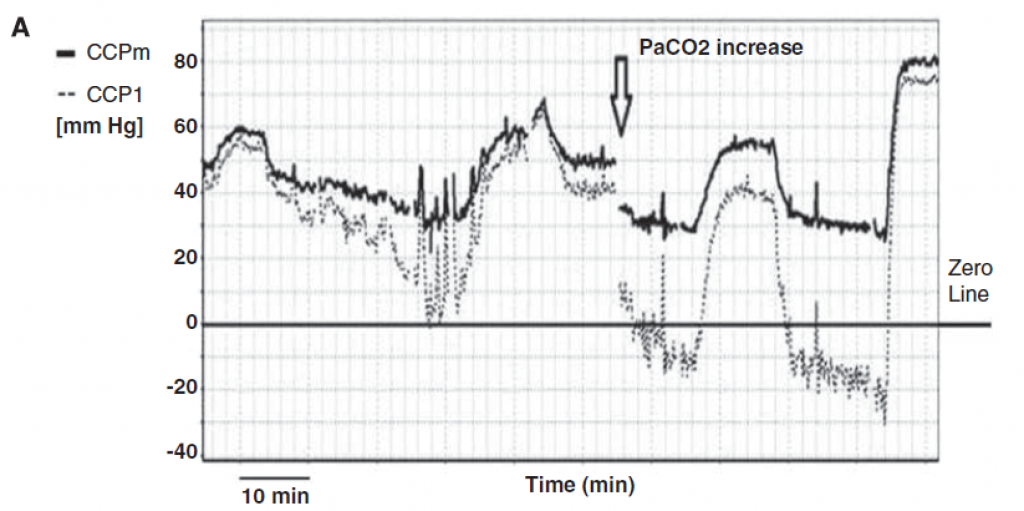
Comparison of the first harmonic model of critical closing pressure (CCP1) and multi-parameter mathematical model (CCPm) in the manoeuvre of an increase in PaCO2 (after 13:10). At high PaCO2, CCP1 decreased to non-physiological negative values, while CCPm stayed positive. View image

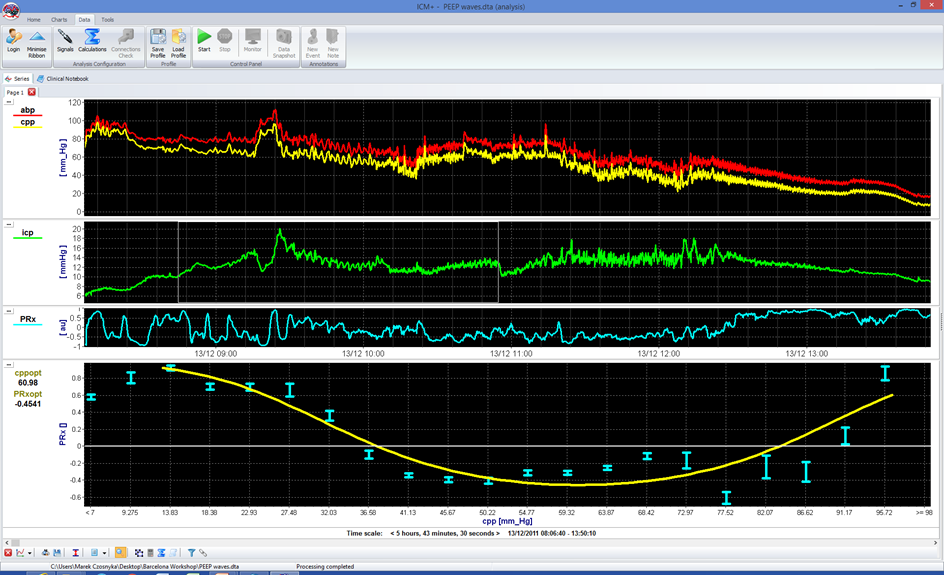
1 minute PEEP wave were added to modulate end-expiratory pressure. A wave was transmitted to ABP and ICP with phase-shift dependent on state of autoregulation. This produced a PRx value free from noise with the calculation of optimal CPP much more precise (lower graph) View image
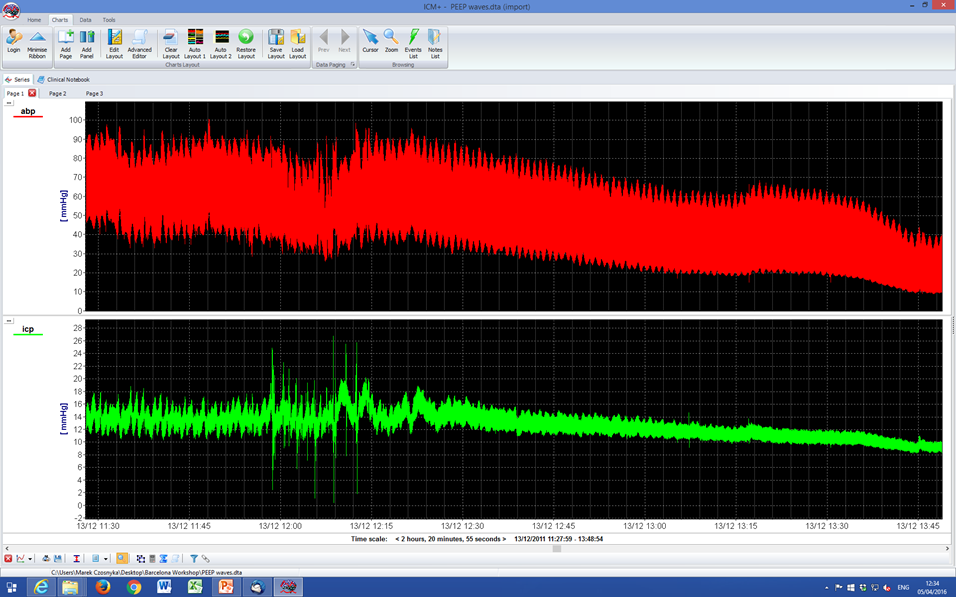

1 minute PEEP wave were added to modulate end-expiratory pressure. A wave was transmitted to ABP and ICP with a phase shift dependent on state of autoregulation. This produces a PRx value free from noise, with the calculation of optimal CPP much more precise (lower graph) View image
Shunt Evaluation Laboratory
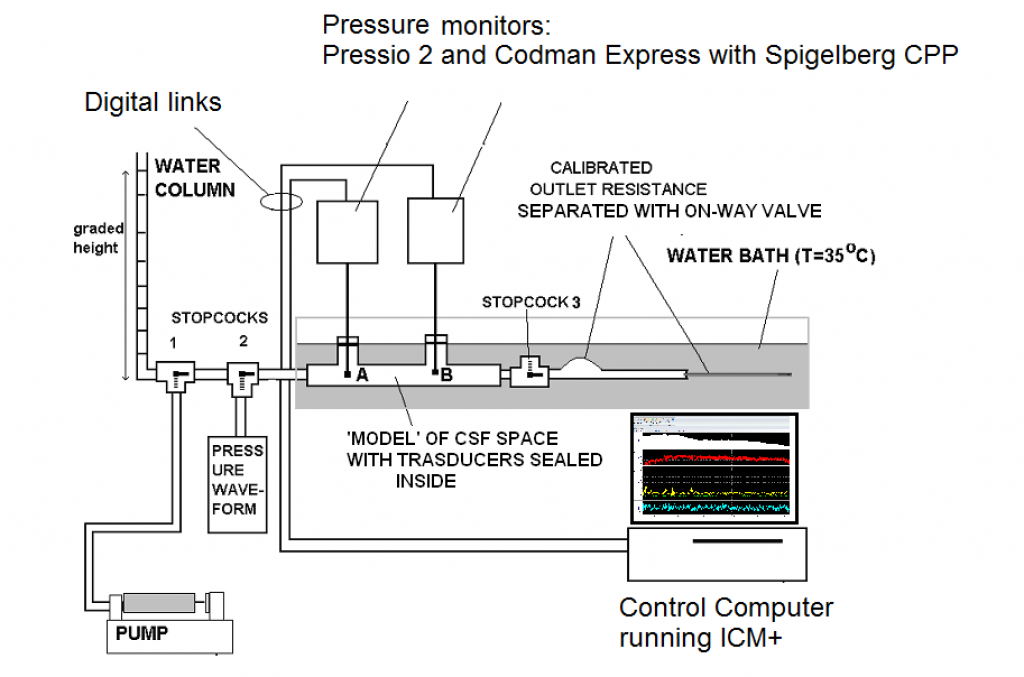
ICM+ supports the Cambridge Shunt Evaluation Laboratory. It is used for evaluating hydrocephalus shunts and novel pressure transducers. Flow and pressure are measured and compared to each other using different protocols (depending on the construction of the shunt or transducer). Here, the rig from a project comparing Codman ICP transducer to Pressio 2 is presented as an example.
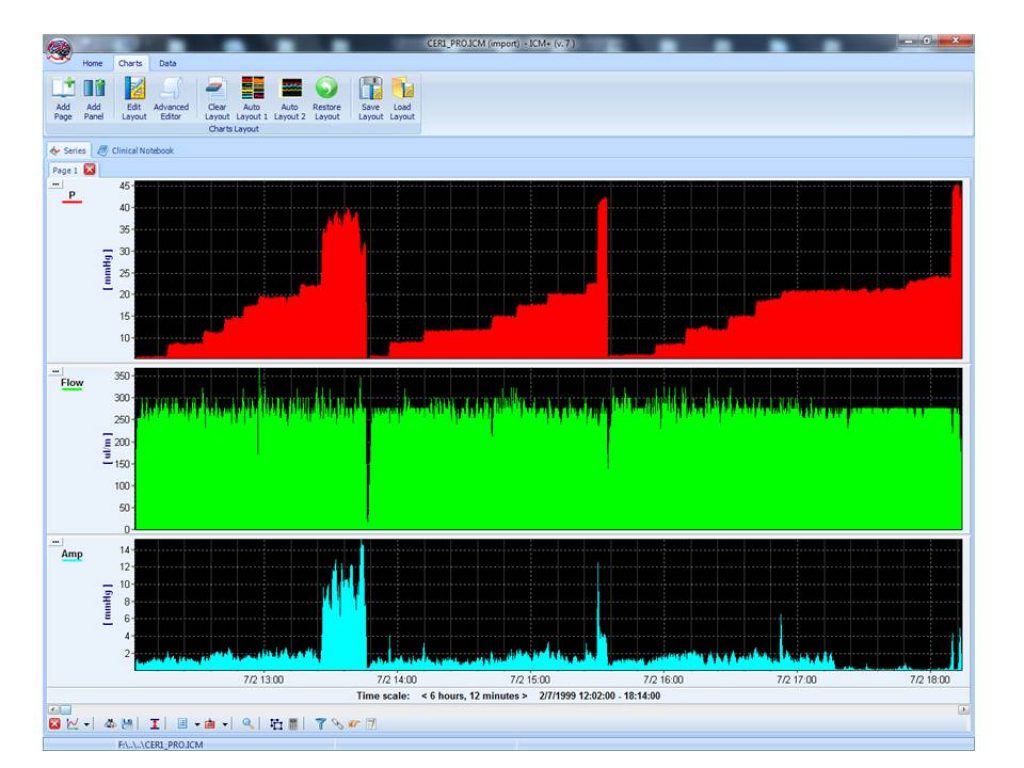
This is an example of a pressure response of an adjustable shunt perfused with constant flow (around 0.3 ml/min- physiological CSF production rate) to change its settings. This was a Certas2 valve with 7 settings; an additional 8th setting is a ‘stop-flow’ of very high operating pressure, ranging 40 mm Hg. View image
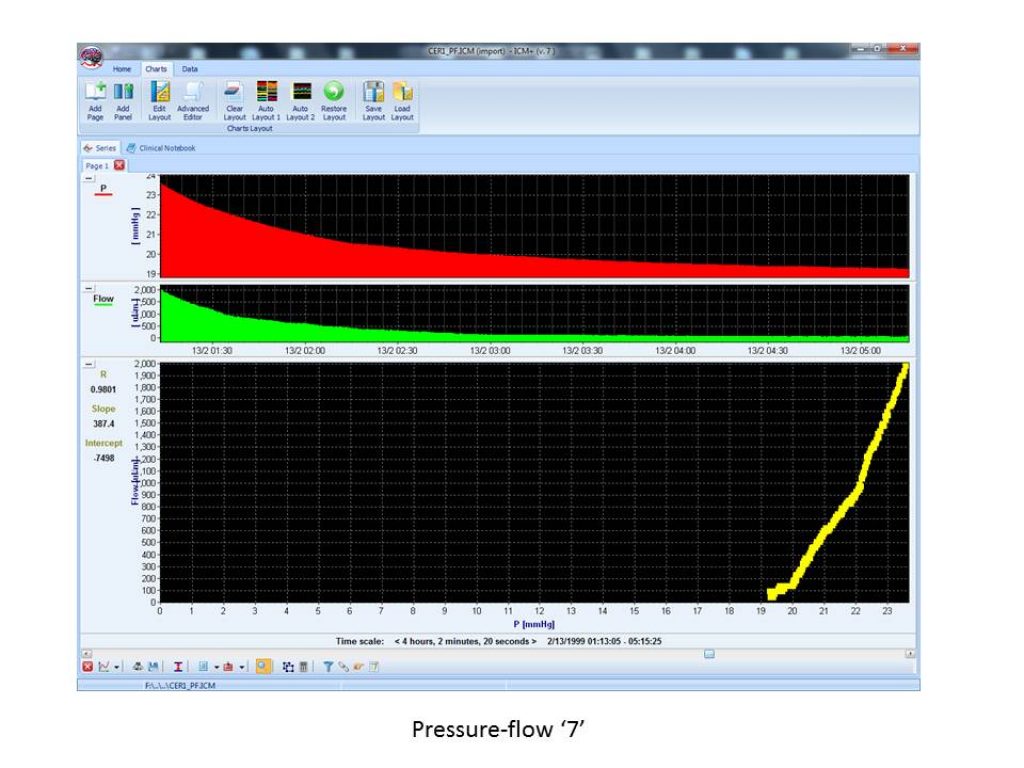
The pressure-flow characteristic of the shunt of a definitive setting measured over a long time. Water is flowing out of the testing cylinder, decreasing the pressure. Plotting flow over pressure permits the display of the non-linear character of the pressure-flow performance curve. View image
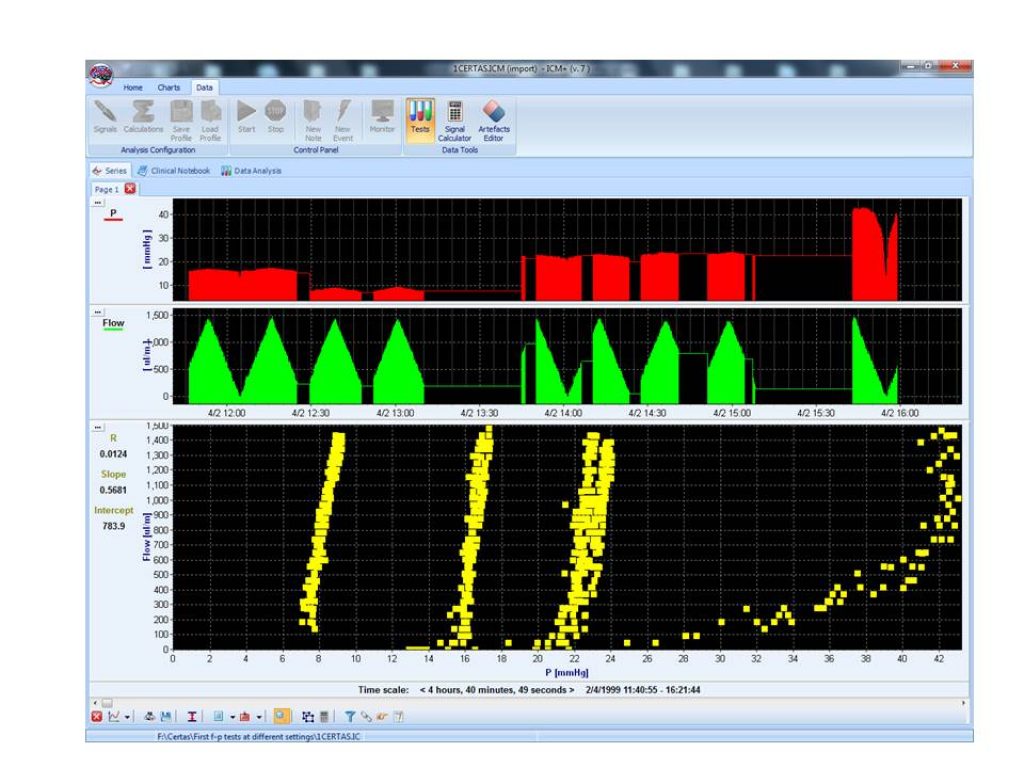
The family of pressure-flow characteristics of the adjustable Certas 2 valve measured with a rig: shunts at different settings were perfused from the pump with a triangular-shape flow pattern. The pressure response was measured, and flow was plotted versus pressure for settings 3,5,7 and 8.