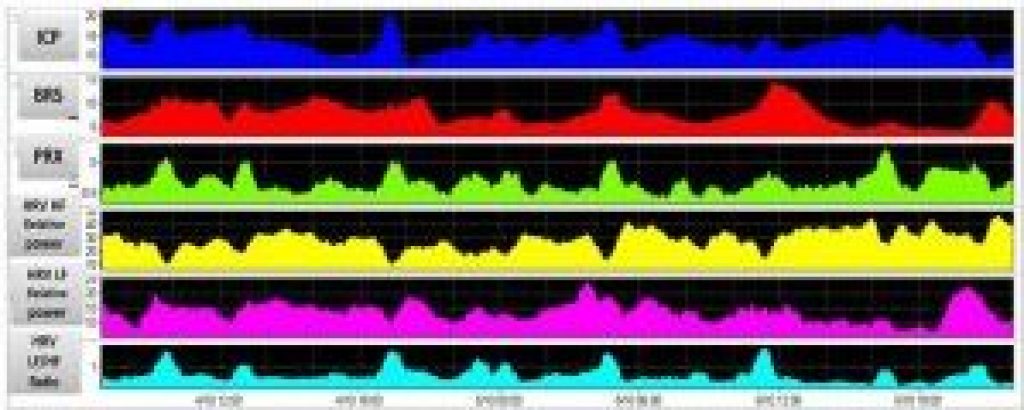
Various areas of miscellaneous clinical research are creatively supported by dedicated ICM+ functions.
One example is creating time trends of heart rate variability and baroreflex sensitivity through dedicated functions that take input data from ECG or arterial pressure waveforms. Those trends can be then compared and analysed together with other indices and measures like cerebral autoregulation metrics, CPP, etc.

Sykora M, Czosnyka M, Liu X, Donnelly J, Nasr N, Diedler J, Okoroafor F, Hutchinson P, Menon D, Smielewski P.

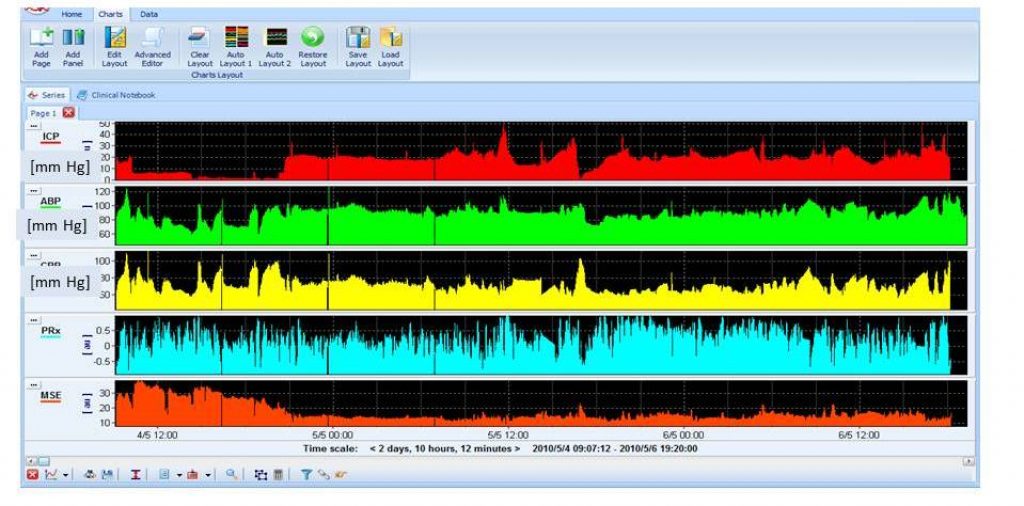
The complexity of brain signals using multi-scale entropy or other measures of complexity may be used to compare change complexity during intracranial hypertension and dysautoregulation. It has been demonstrated that the complexity of ICP correlates more strongly with outcome than does mean ICP (worse outcome can be translated to lower complexity). View image

Spinal cord pressure following acute spinal cord injury appears to be treated in a similar way as ICP is after acute TBI. PRx can be calculated from spinal cord pressure and arterial blood pressure slow waves. In most cases, spinal cord pressure is elevated (~ 30 mm Hg), cord perfusion pressure is low (40-60 mm Hg), and PRx is above 0.5. View image

PRx plotted against spinal cord perfusion pressure, shows a U-shape curve, suggesting that as in TBI , optimal perfusion pressure in spinal cord injury exists. View image

ICM+ can also be used to record physiological data from monitors during surgery. Here is an example of TCD flow velocity and blood pressure monitoring during liver transplant (dissection, anhepatic, and reperfusion phases). In this case, ICM+ was configured to estimate non-invasive ICP (nICP) and the pulsatility index (PI) and on the left and right brain hemispheres. Other examples may include data collection during carotid artery stenosis surgery (http://stroke.ahajournals.org/content/28/5/906.long ) or cardiopulmonary bypass (http://www.sciencedirect.com/science/article/pii/S0022522313009021?via%3Dihub) . View image

