Cerebral autoregulation is the ability of the brain to maintain a relatively constant blood flow during changes in cerebral perfusion pressure (CPP) or arterial blood pressure (ABP). Time trends of indices of cerebral autoregulation can be calculated from spontaneous fluctuations of CPP or ABP and cerebral blood flow velocity (FV).
Mean flow index (Mx and Mxa)
Transcranial Doppler (TCD) -based continuous indices of autoregulation measurement have been readily described within the scientific literature. One of the most common TCD indices is the mean flow index, derived from the moving correlation coefficient between: mean flow velocity (FVm) and CPP (producing Mx), or ABP (producing Mxa). Mx/Mxa close to +1 denotes that slow fluctuations in ABP produce synchronised slow changes in FV, indicating defective cerebral autoregulation. Furthermore, Mx has displayed a moderate correlation to the commonly-employed ICP derived index, pressure reactivity index (PRx), with a correlation coefficient of 0.58.
Cerebral autoregulation index (ARI)
Cerebral autoregulation can also be assessed using the autoregulation index (ARI), a dimensionless index ranging from 0 to 9, for which a response of FV to a hypothetical impulse change in ABP is estimated using transfer function analysis of spontaneous fluctuations in ABP and FV. An ARI of 9 describes a system in which CBF returns quickly to baseline levels after step-changes in ABP; an ARI value of 0 describes a system in which there is no compensatory change in CBF, indicating completely impaired cerebral autoregulation. On this scale, normal autoregulatory capacity is defined as an ARI of 4 to 7, abnormal 3 and below. In ICM+ ARI is implemented as an in-built function, in which FV changes recorded during the step change in ABP are normalised and compared to 10 grades (0-9) to determine which model response constitutes the best fit, and the grade of that response is returned as ARI.
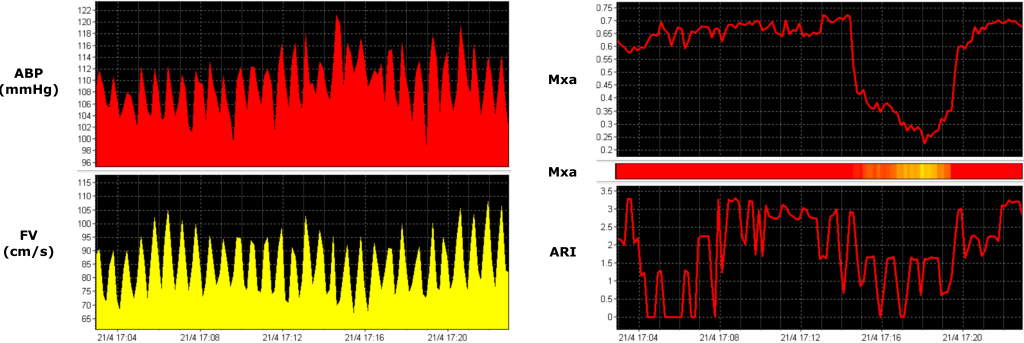
Example of TCD monitoring in a patient after cardiac arrest, containing arterial blood pressure (ABP), cerebral blood flow velocity (FV), and derived autoregulation indices (Mxa, ARI). Oscillations in arterial blood pressure (ABP), being reflected in FV indicate loss of cerebral autoregulation. In the chart Mxa index is also represented by a colour bar grading the strength of autoregulation (RED: above a given threshold; YELLOW: transition zone; GREEN: below a given threshold). View image
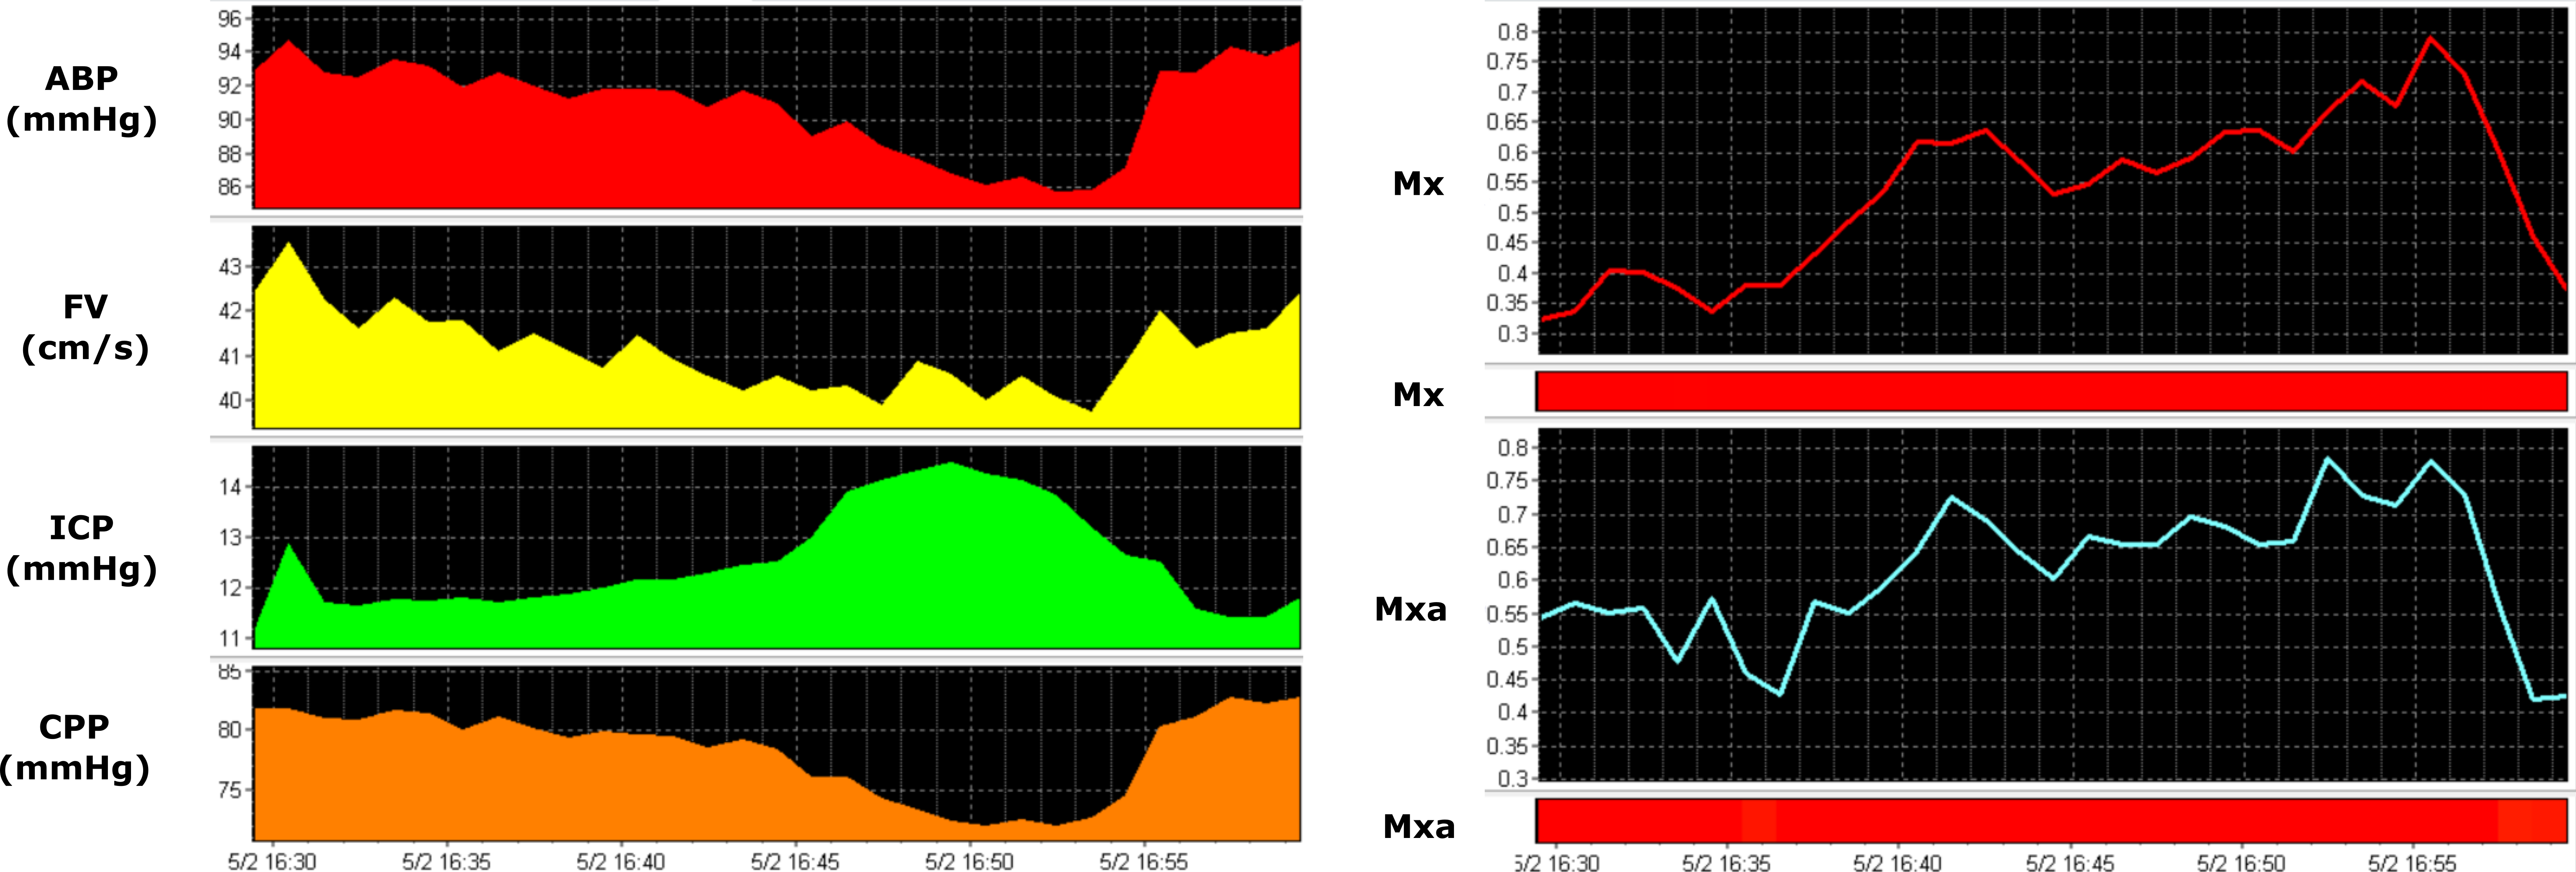
An example of TCD monitoring in a TBI patient, containing arterial blood pressure (ABP), cerebral blood flow velocity (FV), intracranial pressure (ICP), cerebral perfusion pressure (CPP) and derived autoregulation indices (Mx and Mxa). As can be seen in the figure, the colour bar chart for Mx shows persistent impairment of cerebral autoregulation (consistent red colour bar). View image

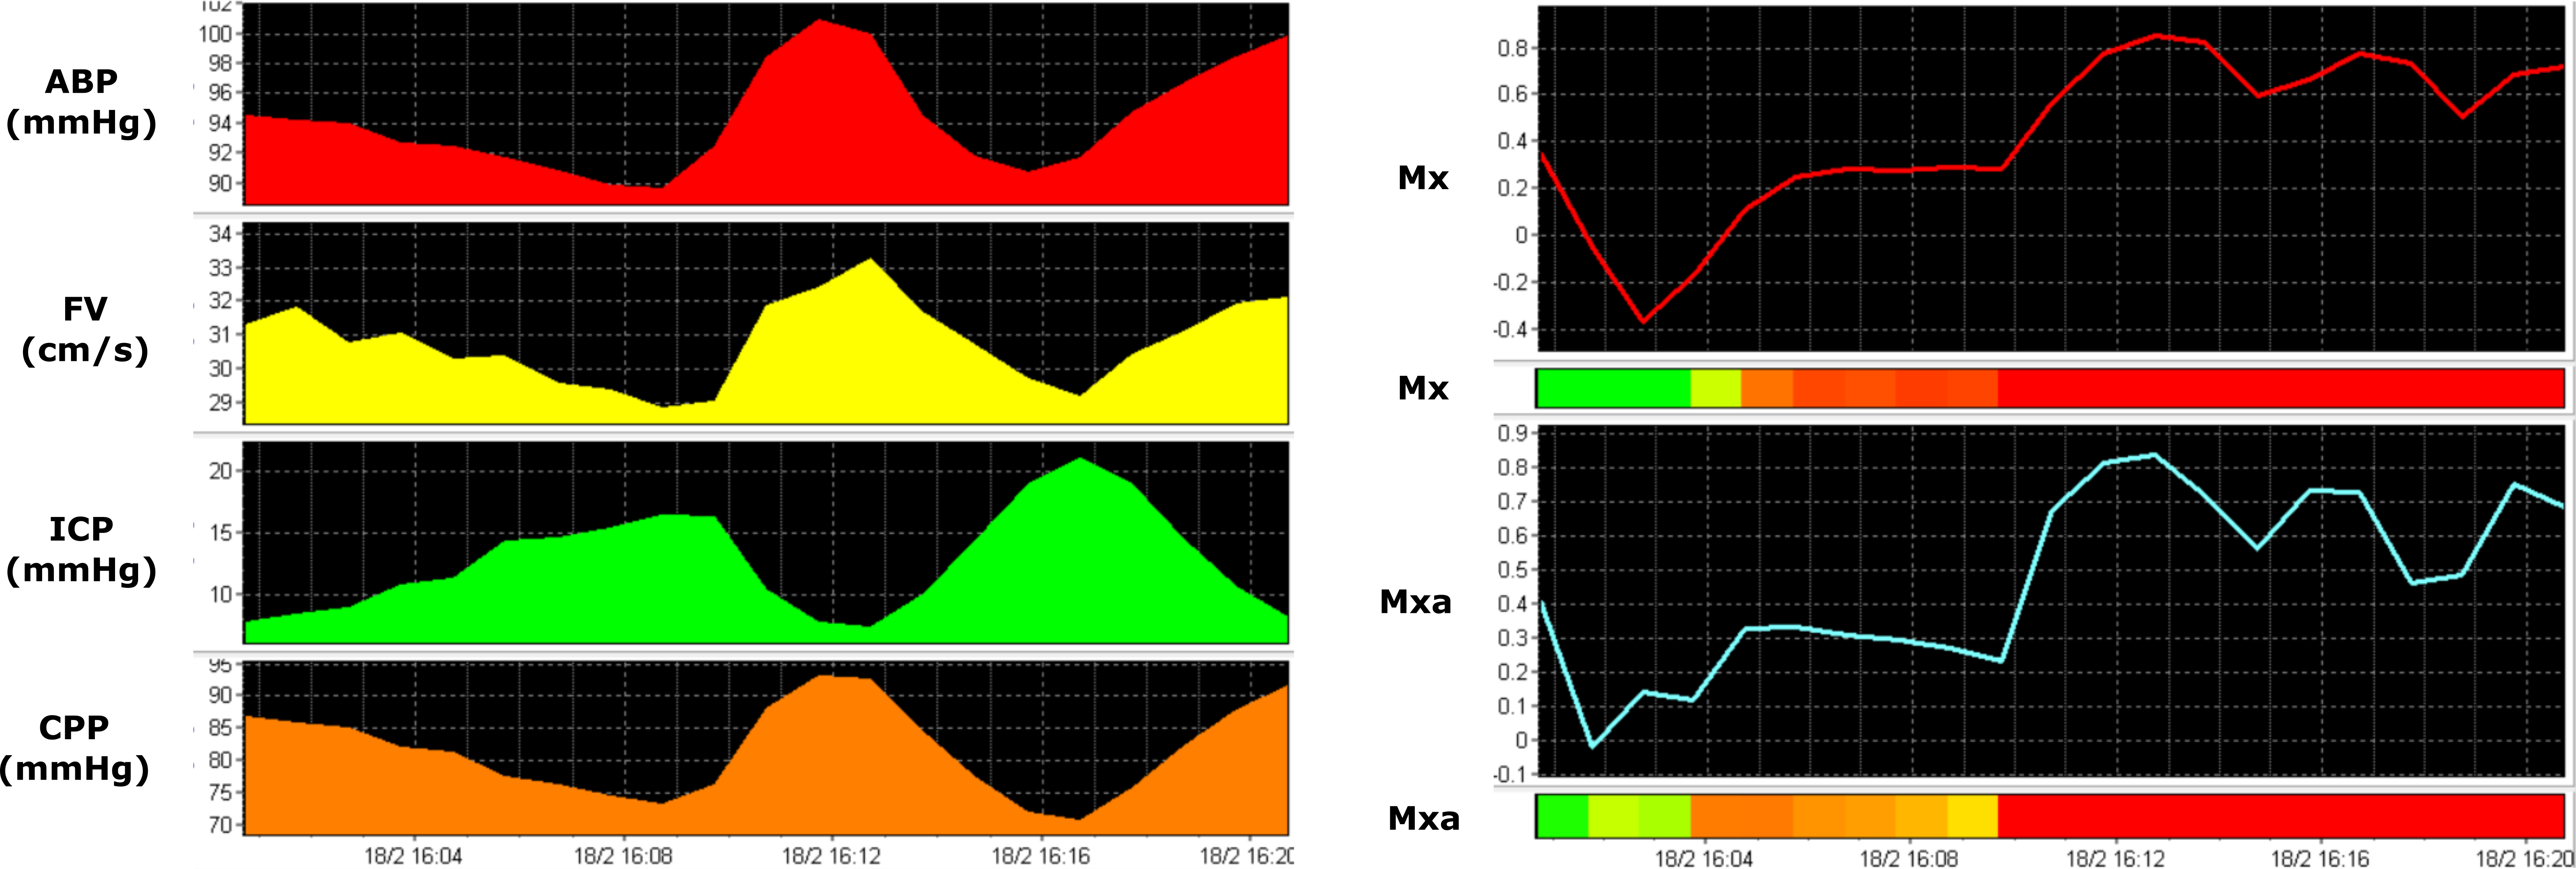
Another example of TCD monitoring in a TBI patient, containing arterial blood pressure (ABP), cerebral blood flow velocity (FV), intracranial pressure (ICP), cerebral perfusion pressure (CPP), and derived autoregulation indices (Mx and Mxa). In this case, a transition from intact (green area of the bar) to impaired (red area) can be observed. View image